
Southern California Seismic Network/TriNet: cooperative project of Caltech and USGS
Egill Hauksson and Kate Hutton, Caltech, Pasadena, CA91125, hauksson@gps.caltech.edu
Lucy Jones and Doug Given USGS, Pasadena, CA 91106, jones@usgs.gov
A sequence of more than 40 small earthquakes has occurred 6 miles north-northeast of Simi Valley since 10 pm (PST) 28 January 2002. The mainshock of M4.2 was preceded by a M3.1 foreshock by 20 seconds. During the first 18 hours of activity, a total of one foreshock, one mainshock and 38 aftershocks have been recorded. The largest aftershocks occurred immediately following the mainshock M3.9 and M3.8, and M3.6 (12:23pm) 14 hour later. These earthquakes were widely felt in Simi Valley, San F ernando and adjacent regions.
We use seismic records to determine the orientation of the fault on which an earthquake occurs. This sequence that is occurring in the depth range of 10 to 13 km exhibits a mixture of strike-slip and thrust faulting. The preferred fault plane dips 60 degrees to the northeast. It is possible that these events are associated with the Santa Susana fault, the major thrust fault in the area with similar strike and dip. However, these are small earthquakes and could just as well be associated with smaller unrecognized oblique slip faults in the region.
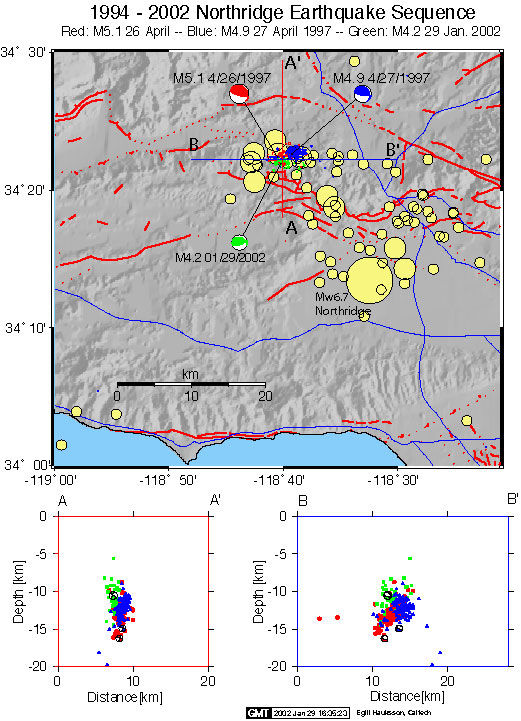
Two earthquakes of M5.1 and M4.9 occurred at the same location on 26 and 27 April 1997. These earthquake sequences were also followed by numerous aftershocks and occurred at a greater depth of 12 to 17 km, about 3 to 5 km deeper than the 2002 sequence. The 1997 and 2002 sequences both reflect the ongoing compression of the Ventura basin. Furthermore, both of these sequences occurred in the aftershock zone of the Mw6.7 1994 Northridge earthquake and are considered to be part of the decaying Northridge sequence. The current rate of earthquakes in the Northridge aftershock zone is two to three times higher than the background rate, recorded before the mainshock in 1994.
The attached figure shows the 1997 M5.1 and M4.9 sequences in red and blue. The 2002 sequence is shown in green. In map view we also show the earthquakes of magnitude equal or greater than 4.0 in the area since 1981. All of the aftershock sequences define steeply dipping zones. The first motion focal mechanisms are also shown in both map view and included in the cross sections.